BELLUNA
![]()
BELLUNA
![]()
(unit: million yen)
| 2022/3 | 2023/3 | 2024/3 | 2025/3 | 2026/3 | |
|---|---|---|---|---|---|
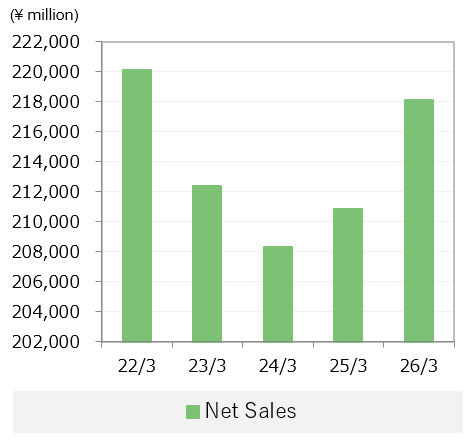
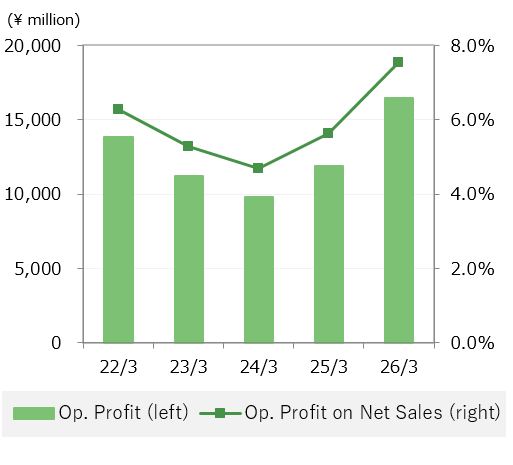
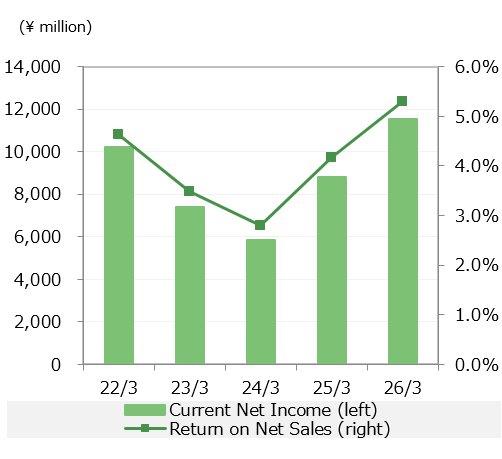
| Net Sales | 220,128 | 212,376 | 208,298 | 210,856 | 218,098 |
| Cost of Sales | 90,822 | 86,674 | 81,953 | 81,604 | 80,881 |
| Gross Profit | 129,305 | 125,701 | 126,345 | 129,251 | 137,217 |
| Selling and General Expenses | 115,478 | 114,484 | 116,557 | 117,364 | 120,739 |
| Operating Profit | 13,827 | 11,217 | 9,787 | 11,887 | 16,478 |
| Recurring Profit | 14,537 | 12,459 | 11,831 | 13,255 | 16,274 |
| Current Net Profit | 10,204 | 7,417 | 5,839 | 8,797 | 11,542 |
(unit: million yen)
| 2022/3 | 2023/3 | 2024/3 | 2025/3 | 2026/3 | ||
|---|---|---|---|---|---|---|
| ASSETS | ||||||
| Current Assets | 118,133 | 122,664 | 129,961 | 131,443 | 131,458 | |
| Total Fixed Assets | 136,045 | 162,928 | 170,730 | 181,018 | 208,679 | |
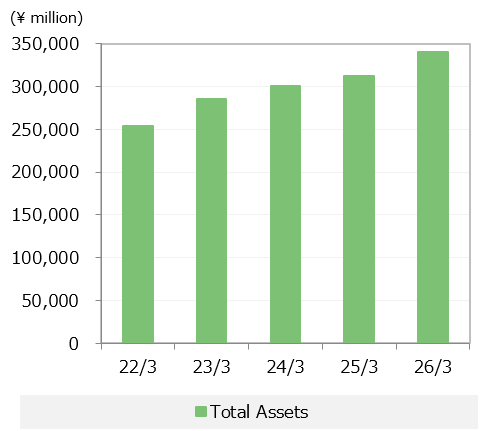
| Total Assets | 254,178 | 285,592 | 300,691 | 312,462 | 340,137 | |
| LIABILITIES and NET ASSETS | ||||||
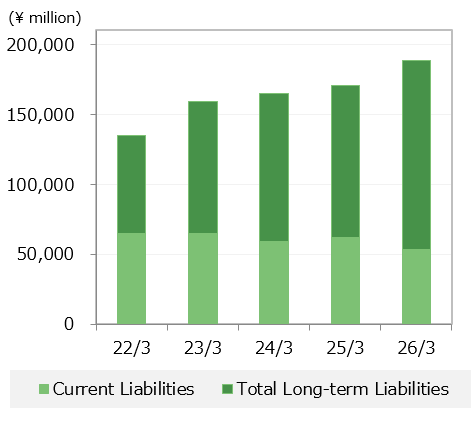
| Current Liabilities | 64,904 | 64,587 | 59,206 | 61,616 | 53,332 | |
| Total Long-term Liabilities | 70,229 | 94,568 | 105,302 | 109,189 | 135,351 | |
| Total Liabilities | 135,134 | 159,155 | 164,509 | 170,805 | 188,683 | |
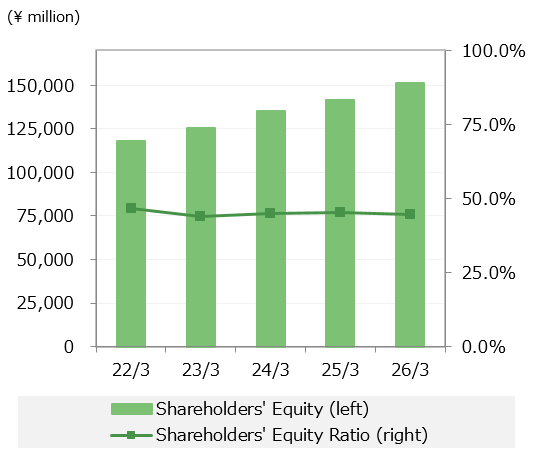
| TOTAL SHAREHOLDERS' EQUITY | 124,228 | 129,765 | 133,652 | 140,149 | 148,868 | |
| Common stock | 10,612 | 10,612 | 10,612 | 10,612 | 10,612 | |
| Capital Surplus | 10,951 | 10,951 | 10,950 | 11,375 | 11,378 | |
| Retained earnings | 103,131 | 108,663 | 112,545 | 118,956 | 127,659 | |
| Treasury stock | -467 | (462) | (455) | (794) | (782) | |
| Total Accumulated Other Comprehensive Profit | (5,959) | (4,268) | 1,539 | 1,164 | 2,474 | |
| Total Minority Interests | 775 | 940 | 990 | 342 | 111 | |
| Total Net Assets | 119,044 | 126,436 | 136,182 | 141,656 | 151,454 | |
| TOTAL LIABILITIES and NET ASSETS | 254,178 | 285,592 | 300,691 | 312,462 | 340,137 | |
(unit: million yen)
| 2022/3 | 2023/3 | 2024/3 | 2025/3 | 2026/3 | |
|---|---|---|---|---|---|
| Cash Flows From Operating Activities | 7,154 | 8,241 | 12,770 | 9,689 | 18,465 |
| Cash Flows From Investing Activities | (17,033) | (29,924) | (14,403) | (17,792) | (32,288) |
| Cash Flows From Financing Activities | 8,652 | 23,527 | 5,971 | 6,721 | 13,907 |
| Effect of exchange rate change on cash and cash equivalents |
(162) | 414 | 1,077 | 349 | 260 |
| Net increase(decrease) in cash and cash equivalents | (1,389) | 2,259 | 5,416 | (1,032) | 345 |
| Cash and cash equivalents at beginning of period | 30,958 | 29,569 | 31,828 | 37,245 | 36,213 |
| Cash and cash equivalents at end of period | 29,569 | 31,828 | 37,245 | 36,213 | 36,558 |