BELLUNA
![]()
BELLUNA
![]()
| Item | 2022/3 | 2023/3 | 2024/3 | 2025/3 | 2026/3 | ||
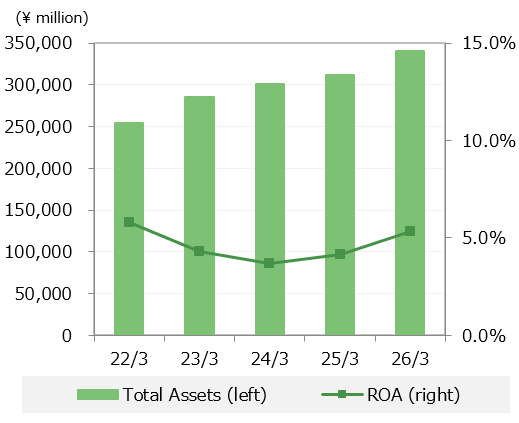
| Scale | Total Assets | 254,178 | 285,592 | 300,691 | 312,462 | 340,137 | |
| Total Fixed Assets | 136,045 | 162,928 | 170,730 | 181,018 | 208,679 | ||
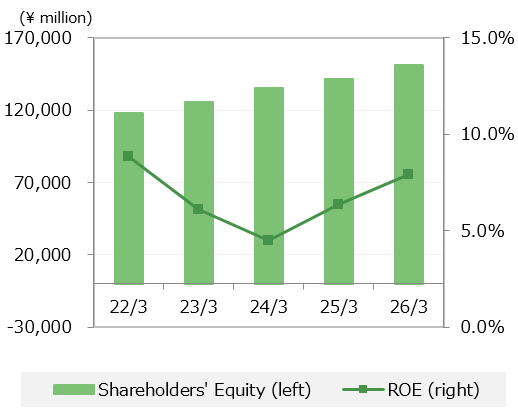
| Shareholders' Equity | 118,269 | 125,496 | 135,191 | 141,314 | 151,342 | ||
| Profitability | Gross Profit on Net Sales | 58.7% | 59.2% | 60.7% | 61.3% | 62.9% | |
| Return on Net Sales | *1 | 4.6% | 3.5% | 2.8% | 4.2% | 5.3% | |
| Selling and General Expenses on Net Sales | *2 | 52.5% | 53.9% | 56.0% | 55.7% | 55.4% | |
| ROE | *3 | 8.8% | 6.1% | 4.5% | 6.4% | 7.9% | |
| ROA | *4 | 5.8% | 4.3% | 3.7% | 4.2% | 5.3% |
| Item | 2022/3 | 2023/3 | 2024/3 | 2025/3 | 2026/3 | ||
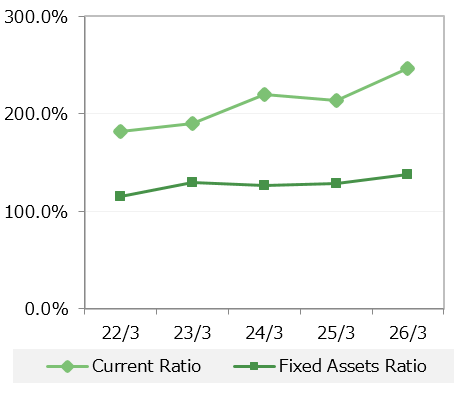
| Stability | Current Ratio | *5 | 182.0% | 189.9% | 219.5% | 213.3% | 246.5% |
| Fixed Assets Ratio | *6 | 115.0% | 129.8% | 126.3% | 128.1% | 137.9% | |
| Long-term Conformity Ratio | *7 | 72.2% | 74.0% | 71.0% | 72.3% | 72.8% | |
| Shareholders' Equity Ratio | *8 | 46.5% | 43.9% | 45.0% | 45.2% | 44.5% | |
| Step Current Ratio | *9 | 1.6 | 1.8 | 2.1 | 2.0 | 1.9 | |
| Debt Ratio | *10 | 28.9% | 37.0% | 37.1% | 40.9% | 42.9% |
| Item | Unit | 2022/3 | 2023/3 | 2024/3 | 2025/3 | 2026/3 | ||
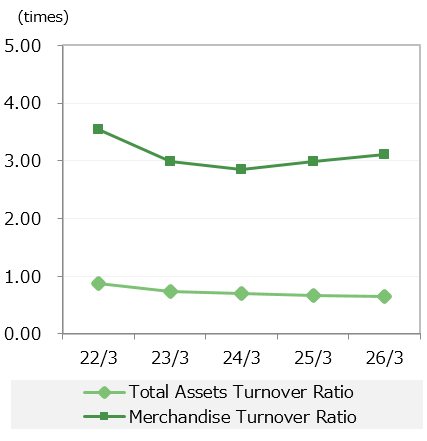
| Efficiency | Total Assets Turnover Ratio | times | *11 | 0.9 | 0.7 | 0.7 | 0.7 | 0.6 |
| Merchandise Turnover Ratio | times | *12 | 3.5 | 3.0 | 2.8 | 3.0 | 3.1 |
| Item | Unit | 2022/3 | 2023/3 | 2024/3 | 2025/3 | 2026/3 | ||
| Productivity | Productivity of Assets | *13 | 50.9% | 44.0% | 42.0% | 41.4% | 40.3% | |
| Productivity of Labor | million yen | *14 | 20.8 | 20.4 | 18.6 | 19.4 | 21.0 | |
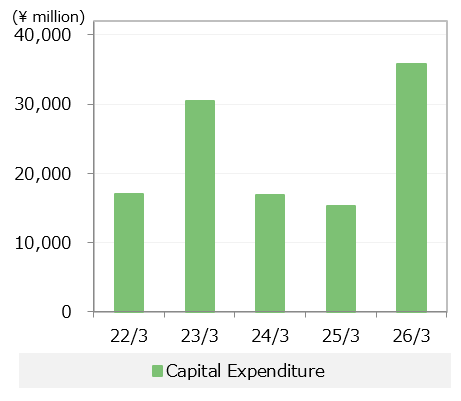
| Others | Capital Expenditure | million yen | 17,046 | 30,489 | 16,933 | 15,229 | 35,871 | |
| Number of Shares Outstanding | thousand shares | 97,244 | 97,244 | 97,244 | 97,244 | 97,244 | ||
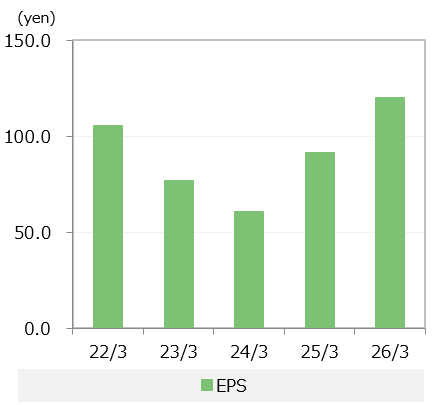
| EPS | yen | 105.6 | 76.7 | 60.4 | 91.3 | 119.9 | ||
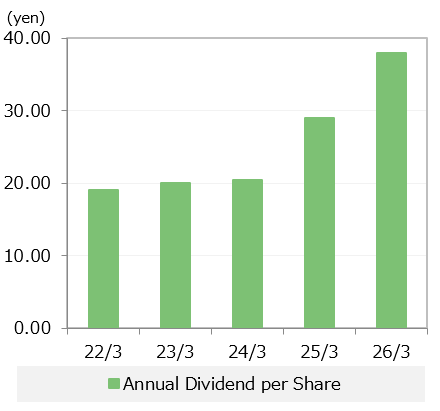
| Annual Dividends per Share | yen | 19.00 | 20.00 | 20.50 | 29.00 | 38.00 | ||
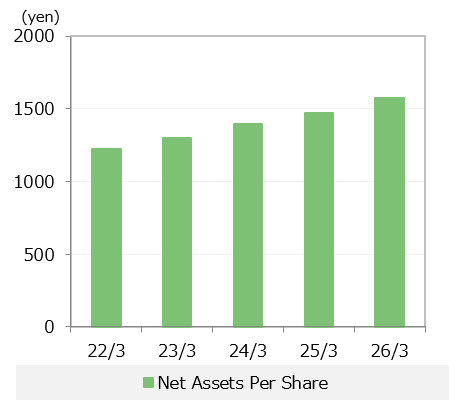
| Net Assets Per Share | yen | 1,223.2 | 1,297.9 | 1,398.1 | 1,468.5 | 1,572.5 |